
Open Shopify Analytics and you see one session count. Open GA4 and you see a different one. Open Search Console and you see clicks that match neither. Nothing is broken. The tools are measuring different things, and once you know what each one counts, the gaps stop being alarming and start being useful.
Then there is the other half of the question. Some competitor keeps outranking you and you want to know how much traffic they actually get. Any free Shopify traffic checker will hand you a number in about two seconds. Most of those numbers are estimates, and for a store your size they are usually poor ones.
This post covers both halves. First, the four numbers your own store already has, what each one counts, and why they will never line up. Then what a Shopify traffic checker actually measures, how far off it runs for small stores, and the proxies I use instead when I need a rough read on a competitor. At the end, the single metric I think is worth writing down once a month.
I am using my own numbers throughout. Studio Niza is a new site, so the figures are small, and that is the point. A screenshot from a store doing 200,000 visits a month would tell you nothing about what your dashboard should look like in month four.
The four traffic numbers your Shopify store already has
Before you go looking for a checker tool, you already have four measurement systems, and three of them are free. They answer different questions.
Shopify Analytics counts sessions on your storefront, using its own cookies. This is the number tied to your conversion rate, because Shopify is also counting the orders. If you want to know "how many visits did it take to make those sales," this is the number that answers it.
Google Analytics 4 counts sessions and users through a tag you install. It sees traffic sources, landing pages, and behavior across the whole site, including pages Shopify does not treat as storefront. It only sees visitors whose browsers run the tag and whose consent settings allow it.
Google Search Console counts impressions and clicks in Google Search only. It is not a traffic tool. It is a search visibility tool that happens to report the clicks Google sent you. It knows nothing about direct visits, email, social, or ads.
Microsoft Clarity counts sessions and records what people did in them. Its value is the recordings and heatmaps, not the count. If you have not set up Google Search Console properly, start there before adding anything else.
Here is what those four reported for studioniza.com over roughly the same window, May 8 to September 6, 2026.
| Source | What it reported | What it is counting |
|---|---|---|
| Google Search Console | 11,390 impressions, 54 clicks, 373 queries | Google Search only |
| Bing Webmaster Tools | 131 impressions, 1 click, 29 pages | Bing Search only |
| Microsoft Clarity | 117 sessions on the home page, 79 on the journal index | Sessions per page, all sources |
| Google Analytics 4 | Live since September, the shortest history of the four | Consented sessions, all sources |
Four sources, four answers, one site. None of them is lying. If some of your visits are arriving from AI answers rather than blue links, that is a fifth read entirely, and I covered how to see traffic arriving from AI search separately.
Why the four numbers never agree
There are four reasons, and they stack. Most owners go looking for a bug when the answer is definitional.
Session definitions do not match
Shopify ends a session after 30 minutes of inactivity and resets every session at midnight UTC, which its documentation on session discrepancies spells out. GA4 also times out after 30 minutes of inactivity, but that timeout is adjustable up to 7 hours and 55 minutes, and GA4 does not start a new session at midnight, per Google's session documentation.
That single difference explains a real gap. If you sell to one country and most of your evening traffic lands near midnight UTC, Shopify will split visits that GA4 keeps whole, and Shopify will report more sessions from the same people. For stores in Asia and Australia, midnight UTC falls in the middle of the working day.
Your cookie banner is deciding what GA4 sees
If you run a consent banner, and you should, GA4 only counts visitors who accept. Google fills some of that gap with modeling, but the thresholds are high. A property needs at least 1,000 events a day with consent denied for seven days, plus at least 1,000 daily users sending consented events, before behavioral modeling turns on. Below that, Google's own wording is direct: visitors who decline are not reported.
Almost no store in its first year clears 1,000 daily users. So if you are a small store with a banner, your GA4 number is the consenting slice of your traffic, and it is structurally lower than Shopify's. That is not a misconfiguration to fix. It is the cost of doing consent properly.
Bots, blockers, and cached reloads
Shopify's analytics discrepancies page lists the rest plainly: some analytics software counts search bots as visitors and some does not, browser extensions block the Google tag outright, Google can only count visitors with JavaScript and cookies active, reporting time zones differ, and Google counts every page reload while a browser serving a cached page may not.
At low volume, one crawler having a busy week can move your percentages by double digits. This is why I do not read month-over-month percentage changes on a store doing under a few thousand sessions. The absolute numbers are small enough that noise looks like a trend.
A click is not a session
Search Console counts clicks in Google Search. GA4 counts sessions on your site. Google's own guidance on using both tools together, updated in January 2026, names the specific reasons they diverge: Search Console reports on the canonical URL Google chose while Analytics reports whatever URL carried the tag, the two use different time zones by default, and Analytics excludes known bots automatically while Search Console does not necessarily filter them.
One person clicking your result, bouncing, and clicking again an hour later is two clicks and two sessions. One person clicking once and browsing eleven pages is one click and one session. Neither tool is wrong. They are answering different questions.
What a Shopify traffic checker actually measures
Now the competitor half. A Shopify traffic checker does not have access to the store's analytics. Nobody outside that store does. What these tools have is some mix of three inputs.
Panel data. Anonymized browsing behavior collected from browser extensions, apps, and internet service providers, then scaled up to represent the whole internet. This is the backbone of the big estimators.
Public storefront signals. Anything readable from the store's own pages: product count, price points, theme, apps loading in the source, review counts, publish dates. This part is genuinely reliable, because it is just reading the page.
Modeling. The arithmetic that turns a small panel sample into a monthly visit estimate for a specific domain.
The middle input is the one worth your time. Store-specific checkers are usually accurate about which apps a store runs, how many products it lists, and what it charges, because those facts are sitting in the HTML. The traffic figure sitting next to those facts comes from a different process entirely, and it deserves a different level of trust.
How wrong are the estimators for a small store?
Wrong enough that I would not make a decision on one. This is not a contrarian take, it is what the vendors say themselves.
Similarweb's own documentation notes that even when you compare the same site across two direct measurement tools, the variance can reach 30 percent, and that for sites with a small number of visits its estimations will not be as statistically accurate. Its knowledge base is explicit that there is no single source of truth across measurement tools.
Read that in context. If direct tools with actual tracking code can be 30 percent apart, an estimate built from a panel that never observed your competitor's store is working with far less. Below roughly 100,000 monthly visits, the panel sample for any one domain gets thin. Below 10,000, most tools return "not enough data" or a placeholder, which is the honest outcome.
My own site returns nothing useful in the estimators, and it should. A hundred or so home page sessions across four months is invisible to a panel. When I published every day for 90 days and showed the data, the interesting numbers all came from Search Console, not from any third-party estimate.
Here is the practical rule I use. Above 100,000 monthly visits, treat an estimate as a rough magnitude and compare stores to each other rather than trusting absolute figures. Between 10,000 and 100,000, treat it as a direction. Below 10,000, ignore it and use proxies instead.
Better proxies for a competitor you can't measure
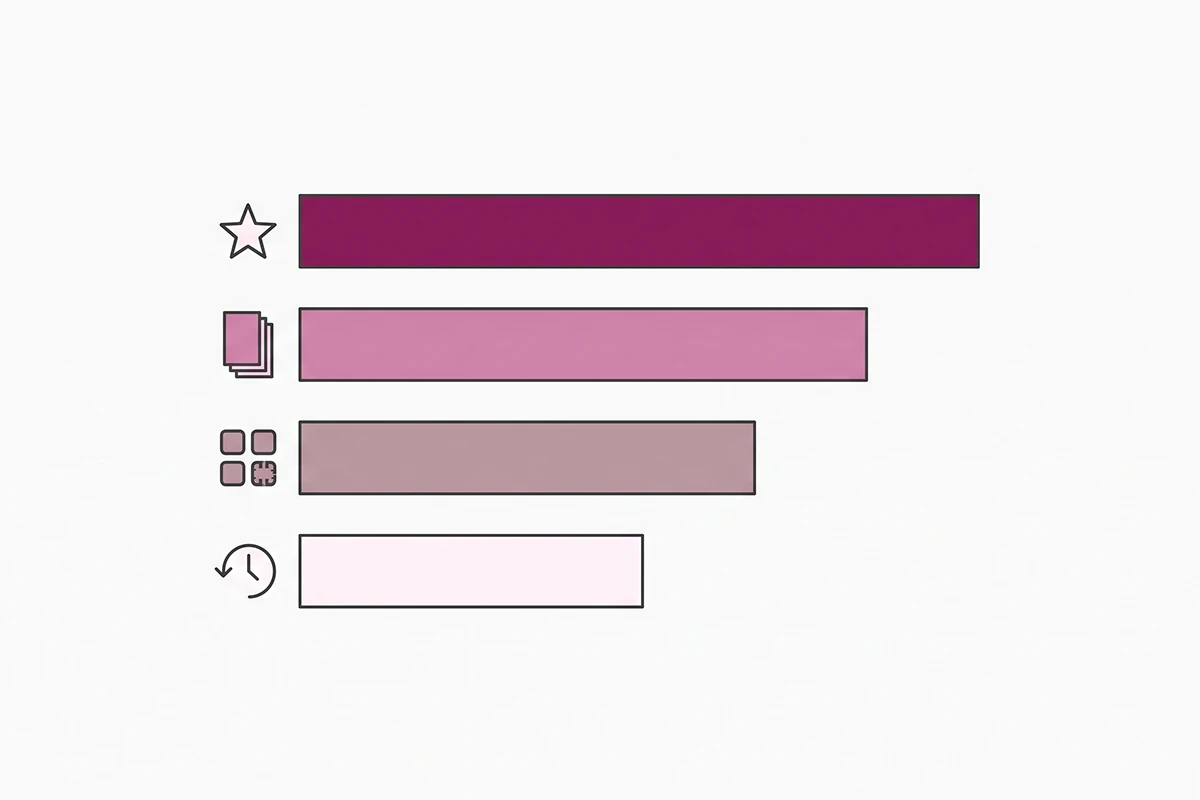
When the number is unavailable, the signals underneath it are not. These four are free, public, and repeatable, which means you can measure change over time even when you cannot measure level.
Review velocity
Open their best-selling product and count reviews added in the last 30 days, then the 30 days before that. Review request response rates vary widely by category and by how well the store asks, so the absolute order count you infer will be soft. The trend is not soft. A store adding 40 reviews a month to one product is selling meaningfully more than one adding three, and you can check it again in 60 days.
Indexed pages and publishing pace
Every Shopify store publishes a sitemap at the root of its domain. Open /sitemap.xml on the competitor's store and follow the child files for products, collections, blogs, and pages. Count them. Come back in 60 days and count again.
You are not measuring traffic here. You are measuring commitment, which is often the better question. A store that added 18 blog posts and 40 products in two months is investing. A store whose sitemap has not moved since last year is coasting, and coasting stores are the ones you can outrank.
App footprint
View the source of a competitor's product page and look at what loads. Review apps, help desks, subscription tools, and upsell apps all announce themselves. A store running an enterprise reviews platform and a paid help desk is spending several hundred dollars a month on tooling, which tells you something about the revenue it expects to recover.
The archive trail
Snapshots on the Internet Archive show you what their home page said a year ago, what the prices were, and which products disappeared. Price increases and a narrowing product range usually mean something is working. A store that has rewritten its home page three times in six months is still searching.
None of these gives you a visit count. Together they tell you whether a competitor is growing, which is the thing you were actually trying to learn when you went looking for a traffic checker.
The one metric worth tracking monthly
Search Console impressions, plus the number of distinct queries you appear for. Two numbers, once a month, written down.
Impressions move first. They tell you Google is showing your pages to people, which happens weeks or months before anyone clicks. Query count tells you how wide your coverage is getting, which is the clearest early sign that new content is doing something.
Clicks are the number everyone wants to track, and at small volume they are too noisy to read. My site recorded 54 clicks over 121 days against 11,390 impressions. A single good week would swing the click trend by 20 percent and mean nothing. The impression and query trend over the same period was steady and readable.
One caveat worth knowing: the query table in Search Console does not show everything. Rare queries are held back to protect user privacy, and the table itself is capped, so the listed queries will not add up to your chart total. My own property lists 373 queries, and the real number behind the chart is higher. That is fine for trend reading, and it is why I track the count rather than treating the list as complete.
If you want the fuller version of this, including what to check when sales have not arrived yet, I wrote a separate post on measuring whether your blog is actually working. The short version: pick one source, read it the same way every month, and stop comparing dashboards that were never going to match.
Wrapping up
Three things to take away.
Your four numbers disagree because they count different things. Shopify splits sessions at midnight UTC and after 30 idle minutes. GA4 only counts visitors who consent, and behavioral modeling will not rescue a small store's numbers because the thresholds sit far above where you are. Search Console counts Google clicks and nothing else. Pick the one that answers your actual question and stop reconciling the rest.
A free Shopify traffic checker is reliable about the things it can read off a page, and unreliable about the number you came for. The vendors say so themselves. For stores under 10,000 monthly visits, which includes most stores in their first two years, the estimate is not worth acting on.
Review velocity, sitemap growth, app footprint, and archive snapshots will tell you whether a competitor is growing. That is usually the real question hiding behind "how much traffic do they get."
Here is the honest close. This post exists because shopify traffic checker is a query my own site appears for at position 25, with six impressions and zero clicks. I could have written a listicle of estimator tools like everything else ranking for it. Instead I opened four of my own dashboards and showed you what a real small store looks like, including the parts that are unimpressive. If your numbers are smaller than you hoped, that is the normal shape of month four, not a verdict on your store.
Want the writing and the measurement handled?
The Studio Niza Blog Content service covers keyword research, the writing, schema, and indexing follow-up, plus a monthly Search Console read so you can see what the posts are actually doing.
See how Blog Content works →Or email contact@studioniza.com if you have a specific question about your store. I read every one.
Frequently asked questions
If you're still unsure after reading these, just send the question.
Is there a free Shopify traffic checker that gives exact numbers? +
Not for a store you don't own. Free Shopify traffic checkers estimate visits from panel data and modeling, and no tool outside a store has access to its analytics. For your own store, the exact numbers are already free in Shopify Analytics, GA4, and Search Console.
Why does Shopify Analytics show fewer sessions than GA4? +
Usually it's the reverse, and the cause is session definitions plus consent. Shopify ends a session after 30 minutes of inactivity and also resets at midnight UTC, while GA4 only times out after inactivity. If GA4 is the lower number, your cookie banner is likely the reason, because GA4 only counts visitors who accept.
Can you check a competitor's Shopify store traffic accurately? +
No, and anyone selling certainty is overselling. You can get a rough magnitude for large stores and almost nothing useful for small ones. Review velocity, sitemap growth, and app footprint are better signals because they are public, free, and repeatable month after month.
Does a cookie consent banner lower my GA4 traffic numbers? +
Yes. GA4 only reports visitors who accept analytics cookies unless behavioral modeling is active, and that needs at least 1,000 daily consented users plus 1,000 daily denied events over seven days. Most first-year Shopify stores never reach those thresholds, so the gap stays.
Do I need GA4 if Shopify Analytics is already built in? +
Not on day one. Shopify Analytics ties sessions to orders, which answers the question most owners actually have. Add GA4 when you need traffic sources, landing page behavior, or campaign tracking that Shopify's reports don't cover.
How often should I check my Shopify store traffic? +
Once a month for trends, and only after a change if you're testing something specific. Checking daily at low volume shows you noise, not progress. Write down Search Console impressions and query count on the same date each month and compare those.