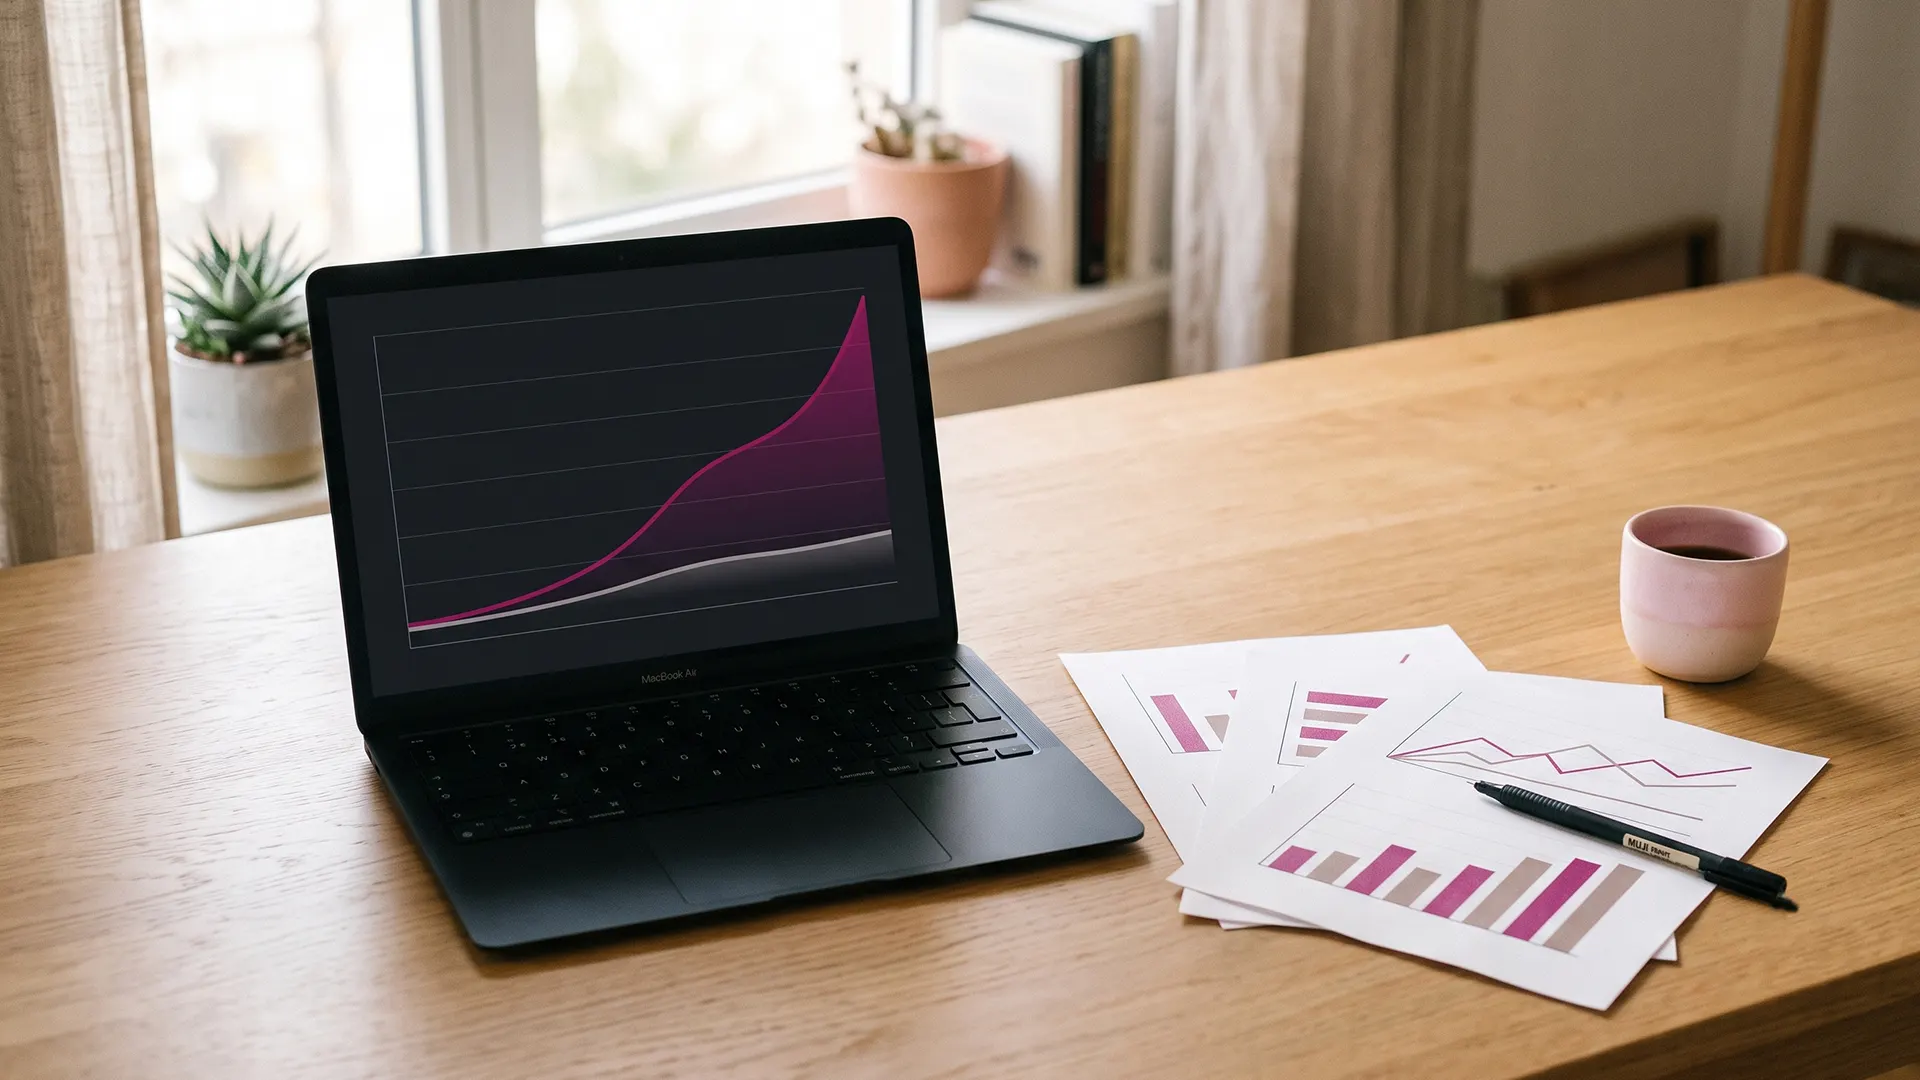
Between May 8 and August 1, 2026, this site published one blog post every single day. That is 86 posts in 86 days, on a brand-new domain with zero backlinks, zero audience, and zero history with Google. This post is the full Search Console export from those first 12 weeks: 8,816 impressions, 47 clicks, and 324 ranking queries. We are publishing all of it because almost nobody shows real daily blogging results for an ecommerce site from a standing start.
You have probably heard that content compounds. It does. But you have usually heard it from people selling content, who show you the month-18 chart and skip the first quarter entirely. The first quarter is where most store owners quit, because the first quarter looks like failure if nobody tells you what it is supposed to look like.
So here is everything. The weeks where the curve pointed up. The keyword that earned 1,644 impressions and zero clicks. The awkward fact that most of our clicks so far came from people who already knew the studio by name. And the honest answer to whether you should copy the daily cadence, which is: probably not, and we will explain why.
One transparency note before the numbers. This post publishes on day 92 of the daily streak. The export covers day 1 through day 86, May 8 through August 1, pulled from Google Search Console on August 3. Web search only, full date range, no cherry-picking.
The headline numbers after 12 weeks
Here is the whole scoreboard for the first 86 days.
| Metric | First 12 weeks (May 8 to Aug 1) |
|---|---|
| Posts published | 86 (one per day) |
| Total impressions | 8,816 |
| Total clicks | 47 |
| Ranking queries | 324 |
| Pages with at least one impression | 62 |
| Overall clickthrough rate | 0.53% |
| Client inquiries from organic search | 0 |
Two things jump out when you read that table honestly. Nearly 9,000 impressions is real visibility for a site that did not exist in April. And 47 clicks against 8,816 impressions is what happens when most of your rankings sit on page 2 and page 3 of the results, which is exactly where a new site lives for months.
Quick definition if the terms feel fuzzy: Google counts an impression each time your page appears in a set of results a searcher could see, whether or not they scroll to it. If you have not wired up your store yet, set up Google Search Console before you publish anything else. Without it, you will have no idea whether any of this is happening to you.
The 324 ranking queries deserve more attention than either headline number. Every query is a doorway Google has started testing your site against. In week 1 there were a handful. By the July 3 export there were 238. By August 1, 324. That growth happened while clicks went almost nowhere, and that gap between visibility and traffic is the entire story of a new site's first quarter.
What the curve looked like, week by week
This is the part agencies do not publish. Every row below comes straight from the export.
| Week | Dates | Impressions | Clicks | Avg. position |
|---|---|---|---|---|
| 1 | May 8 to May 14 | 214 | 18 | 31.0 |
| 2 | May 15 to May 21 | 427 | 11 | 31.1 |
| 3 | May 22 to May 28 | 739 | 3 | 28.4 |
| 4 | May 29 to Jun 4 | 722 | 1 | 24.8 |
| 5 | Jun 5 to Jun 11 | 574 | 4 | 18.0 |
| 6 | Jun 12 to Jun 18 | 632 | 2 | 17.2 |
| 7 | Jun 19 to Jun 25 | 874 | 1 | 18.4 |
| 8 | Jun 26 to Jul 2 | 740 | 1 | 19.4 |
| 9 | Jul 3 to Jul 9 | 876 | 1 | 18.6 |
| 10 | Jul 10 to Jul 16 | 902 | 1 | 22.2 |
| 11 | Jul 17 to Jul 23 | 820 | 2 | 22.1 |
| 12 | Jul 24 to Jul 30 | 1,038 | 1 | 24.5 |
The export ends two days into week 13, with another 258 impressions and 1 click in those two days, so the pace held. Impressions grew roughly fivefold from week 1 to week 12. Monthly, the compounding is even easier to see: 1,752 impressions in May, 2,956 in June, 3,987 in July.
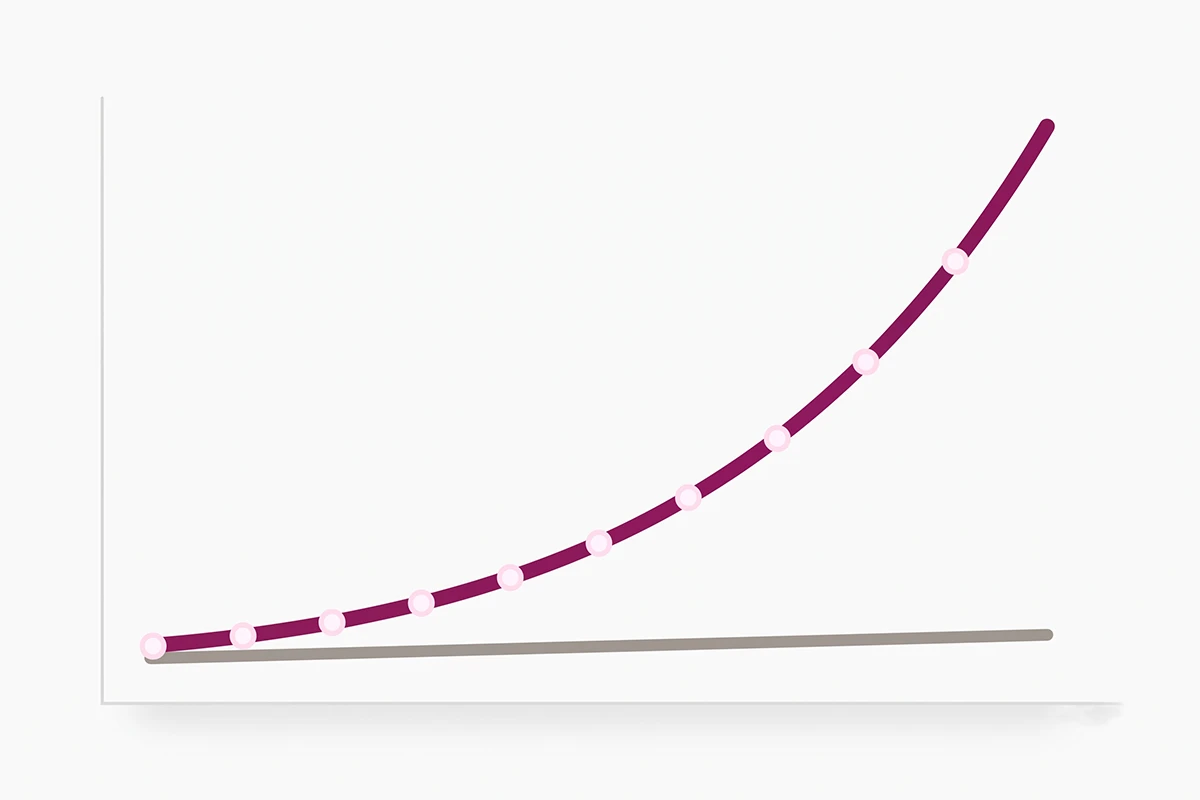
The window breaks into three phases. Weeks 1 and 2 were launch curiosity. The site logged its first impressions on day 2, and 29 of the eventual 47 clicks landed in this stretch. Most of them were people who already knew about the studio, searching for it by name. That is not organic discovery. That is friends, peers, and the founder's own network checking whether the site is real.
Weeks 3 through 8 were the quiet middle. Impressions kept climbing while clicks fell to roughly one a week. If you did not know this phase was coming, you would call it failure and stop publishing. It is not failure. It is Google testing your pages at positions 15 to 40, where searchers almost never scroll.
Weeks 9 through 12 were the compounding phase. Impressions pushed toward 1,000 a week. The single biggest day of the whole window was July 30: 193 impressions, zero clicks. That is the most honest data point in this entire post. Visibility arrives months before traffic does.
Why impressions come months before clicks
The gap is not a mystery. It is position math.
Our biggest keyword, shopify seo checklist, earned 1,644 impressions at an average position of 28. Position 28 is page 3. According to First Page Sage's clickthrough research, the top organic result on a clean results page takes roughly 40 percent of clicks, position 10 takes under 2 percent, and anything past page 1 rounds to zero. A new site can rank for hundreds of queries and still earn almost no traffic, because ranking at position 28 and not ranking at all pay the searcher the same amount: nothing.
The climb from page 3 to page 1 is the slow part, and the industry data says so plainly. Ahrefs studied a million new pages and found that only 1.74 percent reached the top 10 within a year, and that the average page sitting at position 1 is five years old. Google's own documentation tells you to expect four months to a year before SEO work shows its benefit. Twelve weeks in, we are inside the window where the honest answer is: on schedule, not yet paid.
One paradox in the weekly table is worth decoding, because it scares new site owners every time. Our average position improved from 31 to 17 by week 6, then drifted back to 24 by week 12. The site did not get worse. More than 100 new queries entered the data during that stretch, and new queries always enter at low positions. The average is diluted by growth. Judge individual queries, not the site-wide number. We covered the fuller version of this arc in our month-by-month traffic timeline, and this experiment is tracking it almost beat for beat.
Which posts pulled ahead, and why
Sixty-two pages earned impressions, but the distribution is lopsided in an instructive way. Here are the notable performers.
| Post | Impressions | Avg. position | Clicks |
|---|---|---|---|
| Shopify SEO checklist | 2,224 | 30.8 | 3 |
| Reviews app comparison (Judge.me, Loox, Stamped, Yotpo) | 593 | 15.4 | 0 |
| Meta description guide | 534 | 26.6 | 0 |
| Best time to send review requests | 246 | 9.5 | 0 |
| Removing a fake review | 198 | 11.9 | 4 |
| FAQ schema guide | 190 | 19.8 | 5 |
The Shopify SEO checklist post is the impression giant, with a quarter of the site's entire visibility. It targets a high-volume keyword, which means big impression counts and brutal competition. It is parked at the page 3 wall, and it may sit there for months. That trade is what you sign up for when you target head terms as a new site.
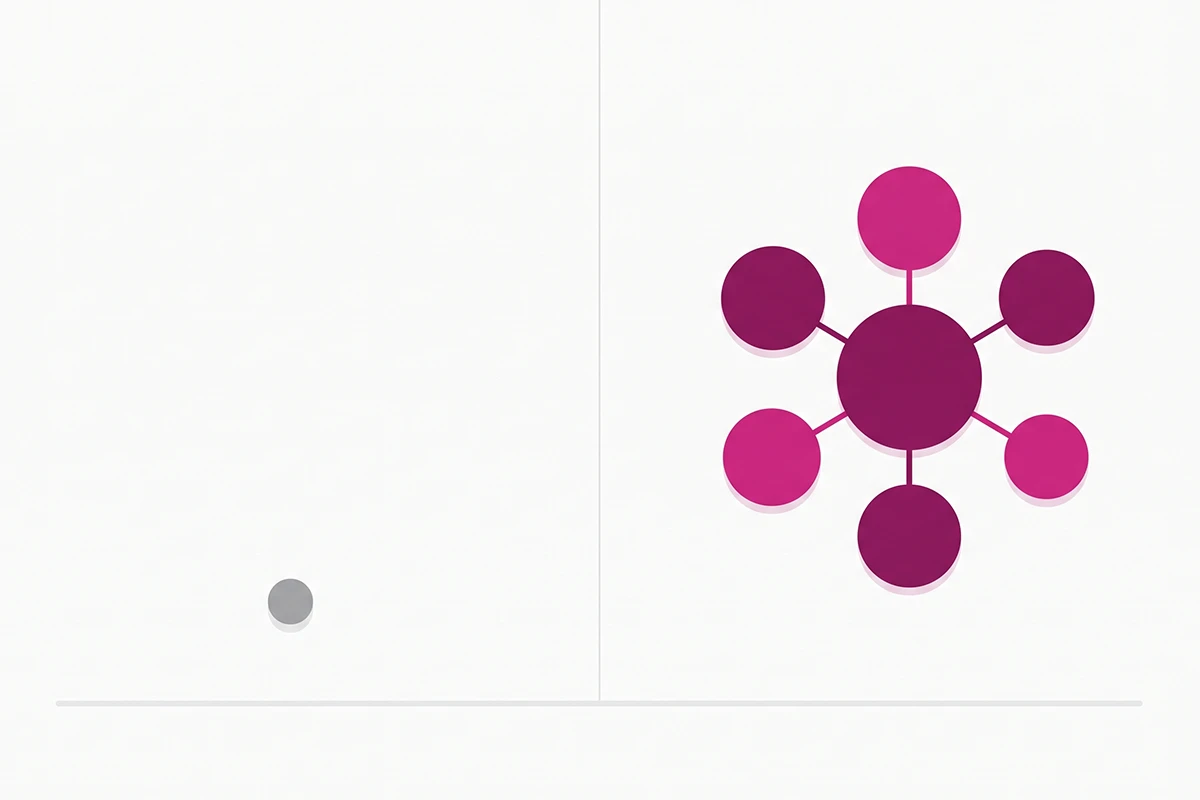
The more interesting pattern is the reviews cluster. We published a connected group of reviews management posts: platform comparisons, review request timing, star snippets, review migration. That cluster holds the best positions on the whole site. Review request timing sits at position 9.5, review migration at 10.0, and a star ratings query reached position 7.6. None of these are huge keywords, but they moved together, which is exactly what a topic cluster is supposed to do. Google appears far more willing to rank a new site that covers one topic deeply than one that touches many topics once.
And the posts that earned actual strangers clicking? The FAQ schema guide (5 clicks at a 2.6 percent clickthrough rate) and the fake review removal guide (4 clicks, 2.0 percent). Both answer a specific, slightly urgent problem with low competition and clear intent. Specific beats broad in the first year. It is not close.
What has not worked yet
This section exists because case studies without it are advertising.
US traffic has not converted to clicks. The United States generated 3,834 impressions, more than any other country, and 6 clicks. Our target market sees us on page 2 and page 3 and scrolls past, because that is what everyone does.
Most of our clicks were not really organic wins. Twenty-nine of the 47 clicks came from the Philippines, where the studio is based and known. The homepage took 17 clicks at a 14.7 percent clickthrough rate, mostly from people searching the studio by name. Strip out brand curiosity and the honest count of strangers who found us through a search and clicked is roughly a dozen.
Zero client inquiries have come from organic search. Eighty-six posts in, blogging has not paid a single invoice. If a content service promises you leads in the first quarter, this is the data they are not showing you.
AI Overviews are squeezing the broad keywords. Ahrefs measured a 58 percent drop in clickthrough for top-ranking pages when an AI Overview appears, and Overviews show up most on exactly the broad informational queries our biggest posts target. The specific, long-tail posts that earned our first real clicks are also the posts least exposed to that squeeze. That is shaping our topic selection going forward.
One smaller observation worth logging: desktop delivered 7,372 impressions at a 0.26 percent clickthrough rate, while mobile delivered 1,417 impressions at 1.98 percent. Small numbers, so hold the conclusion loosely, but mobile searchers clicked us nearly eight times as often.
Should you publish daily or weekly?
Here is the twist. Back in week 1 of this experiment, we published a post arguing that 2 to 3 posts a week beats daily posting for store owners. Then we published daily for 90 days anyway. Both of those things are honest, and the difference matters.
Daily made sense for us for reasons that probably do not apply to you. Writing is the product this studio sells, so every post doubles as a work sample. The time cost lands on one person who chose to absorb it. And a brand-new agency site needed to cover four service topics deeply, fast, to have any topical footprint at all.
Daily rarely makes sense for a store owner. If you are paying per post, 86 posts is a five-figure quarter. If you are writing them yourself between packing orders, quality decays by week 3, and thin posts do not compound, they just accumulate. And we will be straight about the limits of our own data: this experiment has no control group. We cannot prove daily outperformed what 36 excellent posts would have done in the same window. Our cluster data quietly suggests depth mattered more than the calendar.
What is worth copying is the shape, not the pace. Pick one cluster your store can own. Publish 2 to 3 researched posts a week inside it. Wire up Search Console on day 1. Then judge your first 12 weeks on impressions and position movement, not clicks, because you now know clicks are a lagging indicator.
Wrapping up: what week 13 onward looks like
Three takeaways from 86 days of daily blogging results on a new ecommerce-focused site. Impressions come before clicks, by months, and quitting during the gap is the most common way store owners waste a content investment. Clusters move before singles, so depth on one topic beats scattered coverage. And specific posts that solve one urgent problem earn clicks while broad posts are still stuck in line on page 3.
The work from here is unglamorous: keep publishing into the clusters that moved, update the page 3 posts instead of abandoning them, and wait out the window Google itself says takes four months to a year. We will publish the six-month export, including the conversion numbers, whatever they say. If month 6 still shows zero inquiries from organic search, you will read that here too.
If you take one thing from this dataset, take the shape of the curve. The first quarter of blogging looks like nothing is happening. The data says otherwise, but only if you know which numbers to watch.
Want posts like these without writing them yourself?
The Studio Niza blog content service writes 2 to 3 posts a week for your store, built the same way as the 86 posts behind this data: real keyword research, FAQ schema, internal linking, and honest reporting on what is working.
See pricing & services →Or email contact@studioniza.com if you have a specific question about your store. I read every one.
Frequently asked questions
If you're still unsure after reading these, just send the question.
How long does it take for blogging to work for a Shopify store? +
Expect impressions within 2 to 6 weeks and meaningful clicks between month 4 and month 12. Google's own guidance says most SEO work needs four months to a year to show benefit, and our first 12 weeks of data match that timeline. Impressions are the early signal that the work is registering.
Are Search Console impressions worth anything if nobody clicks? +
Yes. An impression means your page appeared in results for a real search, which is the first measurable step toward ranking. Our impressions grew from 214 in week 1 to 1,038 in week 12 while clicks stayed nearly flat, and that pattern is normal for a new site. Clicks follow once average positions climb into the top 10.
Is publishing a blog post every day worth it for ecommerce? +
For most store owners, no. Daily publishing worked for us because writing is the product we sell and the time cost lands on us. If you are paying per post or writing between orders, 2 to 3 well-researched posts a week builds the same authority at a sustainable pace.
Why does my average position get worse as my blog grows? +
Because every new query your site ranks for enters the average, usually at a low position. Our average position improved from 31 to 17, then drifted back to 24 as more than 100 new queries entered the data. That is dilution from growth, not decline, so judge individual queries instead of the site-wide average.
Do AI Overviews make blogging pointless for Shopify stores? +
No, but they change which clicks survive. Ahrefs found AI Overviews cut clickthrough on top-ranking pages by 58 percent, which hits broad informational keywords hardest. Specific, long-tail, problem-solving posts still earn clicks, and they were the first posts in our data to do so.
How many blog posts do you need before Google starts ranking a new Shopify site? +
There is no fixed number, but in our data, clusters moved before singles. Groups of 5 or more related posts on one topic reached positions 10 to 15 within 12 weeks, while standalone posts on competitive topics stalled on page 3. Depth on one topic beats scattered coverage.