
You have published maybe fifteen or twenty posts. You check your Shopify sales report, see the same flat line you saw last month, and start wondering if the blog is a waste of time. This is the most common reason new Shopify owners quit content, and almost always it is a measurement problem, not a content problem.
Here is the honest part. A blog is a slow, compounding channel, and most owners judge it with a fast, last-click yardstick. That mismatch makes healthy blogs look broken. To measure blog ROI on Shopify honestly, you have to know which numbers move first, because revenue is the last thing to move, not the first.
So the real question is not is my Shopify blog working in some final sense. It is whether your blog is showing the early signs that it will work. Those signs are leading indicators, and they appear long before the first sale a post can take credit for.
This post covers the four leading indicators worth watching: impressions, ranking movement, assisted conversions, and AI citations. You will see exactly where each one lives in Google Search Console and GA4, which vanity metrics to ignore, and a one-page monthly review you can run in fifteen minutes. The goal is simple. Give you enough signal to keep going with confidence, or enough signal to change course on purpose instead of quitting in the dark.
Why revenue is the wrong first number to watch
Revenue is a lagging indicator. It moves after everything else has already moved: after Google indexes the post, after the post climbs into a position people actually click, after a reader lands, trusts you, and comes back to buy. Judging the blog by revenue in week six is like judging a fruit tree by the fruit in its first spring.
The timeline is not your fault. It is just how search works now. In a 2025 Ahrefs study of over a million pages, only 1.74 percent of newly published pages reached Google's top 10 within a year, down from 5.7 percent in 2017. Of the pages that did break into the top 10, most got there in roughly 2 to 6 months, and specific low-volume keywords ranked faster than broad competitive ones.
Read that again, because it reframes everything. The blog is not failing at month two. It is doing the quiet early work that shows up in leading indicators first and in revenue last. For the fuller breakdown, I wrote a whole post on how long Shopify blog content takes to drive traffic.
A leading indicator is a number that moves early and predicts the later result. A lagging indicator is the result itself. Impressions, ranking position, assisted conversions, and AI citations are leading. Revenue is lagging. If you want to measure content ROI on Shopify before the ROI is literally in the bank, you watch the leading four and let revenue confirm them later.

Here is the mindset shift that keeps founders in the game. You are not asking whether this post made money yet. You are asking whether this post is moving through the stages that end in money. Those stages are visible right now, for free, in tools you already have.
Leading indicator 1: impressions and ranking movement
Google Search Console is the single most honest tool you own, and it is free. It shows what your pages do inside Google's results before anyone clicks. The two numbers that matter earliest are impressions and average position.
What impressions and position actually mean
An impression means your page appeared in someone's search results, even if they did not click. Rising impressions mean Google is showing your content to more people for more queries, which is the first sign it considers the post relevant. Average position is where you typically rank for those queries, and lower is better: position 8 beats position 30.
Early on, you will see impressions climb while clicks stay near zero. That is normal, and it is good news. Almost nobody clicks results on page three or four, so the clicks start only when a page crosses into the top 10, near the top of page one, because that is where attention lives.
Do impressions matter if nobody is clicking?
Yes, more than almost any other early number. Impressions plus improving position is the clearest proof that a post is on its way up. A page sitting at position 30 with a few hundred impressions and no clicks is not broken. It is queued. Your job is to watch whether that position trends down over the weeks, because that trend is the leading edge of future clicks.
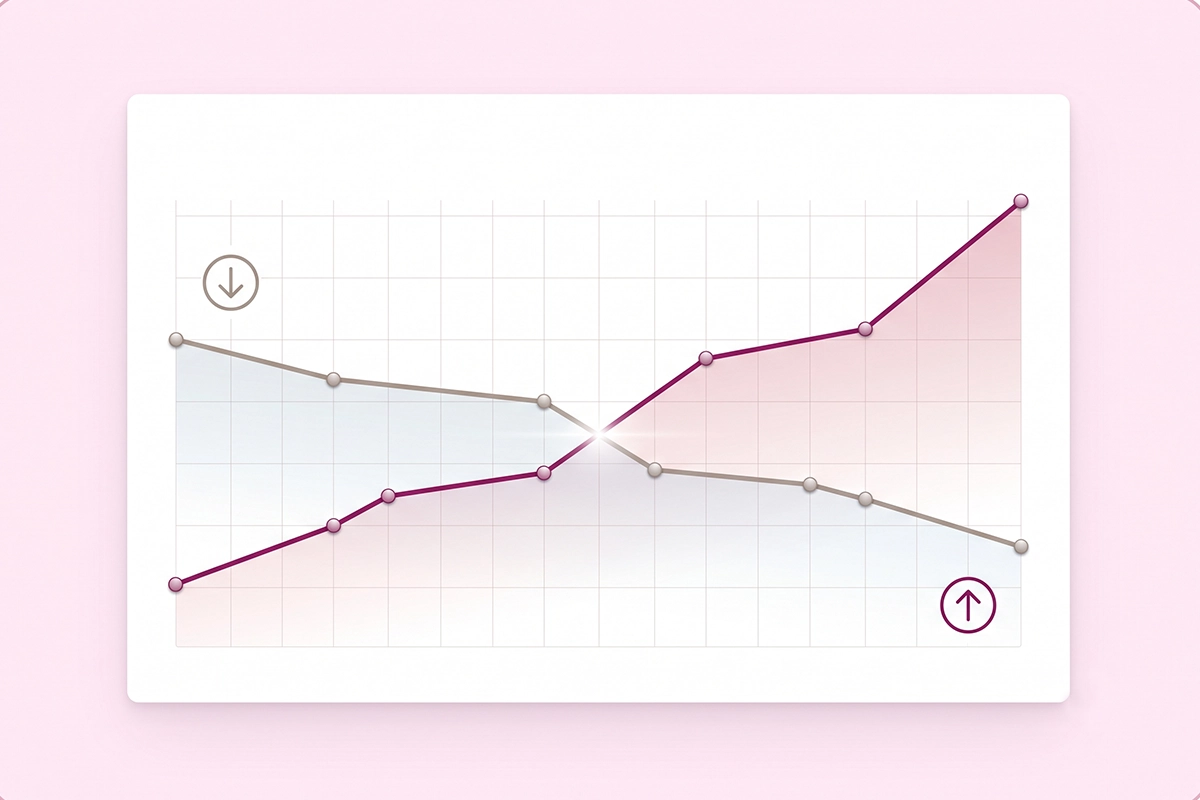
A real example, from this very site. One of Studio Niza's own newer pages has pulled in more than 1,100 impressions while sitting around position 35, with almost no clicks yet. Across the site, impressions roughly tripled over an eight-week window while average position kept improving, and no revenue was attached to any of it. That is exactly what a healthy, pre-click blog looks like.
Where to find it
Open Search Console, go to the Performance report, and turn on all four boxes: Total clicks, Total impressions, Average CTR, and Average position. Set the date range to the last 3 months and compare it with the previous 3 months. You are looking for two lines moving the right way: impressions up, average position down. If both are moving, the blog is working, whatever the sales report says.
| Search Console metric | What it means | What "working" looks like |
|---|---|---|
| Impressions | Times your page showed in results | Trending up month over month |
| Average position | Your typical rank for those queries | Trending down, toward 1 |
| Clicks | People who clicked through | Start rising once position enters the top 10 |
| CTR | Clicks divided by impressions | Improves as position and titles improve |
Leading indicator 2: assisted conversions
Here is the trap that makes blogs look worthless. The blog almost never gets the last click before a sale. A shopper reads your guide, leaves, thinks about it, comes back three days later through a branded search or a direct visit, and buys. Last-click attribution hands all the credit to that final visit and none to the post that started the whole thing.
Assisted conversions fix that. An assisted conversion is a sale the blog helped cause without being the final step. If you only ever look at last-click, you will systematically undervalue content and over-credit whatever channel happens to close.
Where to find it in GA4
In GA4, go to Advertising, then Attribution, then Conversion paths. This report shows the full sequence of touchpoints before a purchase, split into early, middle, and late stages. Data-driven attribution is the default model in 2026, which spreads credit across the touchpoints that actually influenced the sale instead of dumping it all on the last click.
If your blog shows up often in the early and middle columns, it is doing its job: starting journeys that other channels finish. That is the assist, and it is a real part of blog analytics for ecommerce that last-click reporting hides.
What to do when you do not have enough sales yet
Most first-year stores do not have enough conversions for attribution models to say much, and that is fine. At low volume, do not force the fancy report. Instead, open Reports, then Engagement, then Landing page, and look at your blog URLs. Check two things: whether people engage with the post (engaged sessions and average engagement time), and whether any of them later trigger an add-to-cart or purchase.
Even a handful of engaged blog sessions that later convert is a real signal. Attribution at this stage is directional, not precise, and that is okay. You are looking for evidence the content pulls its weight, not a courtroom proof.
Leading indicator 3: AI citations and referral traffic
A newer signal has quietly become one of the most useful. When someone asks ChatGPT, Gemini, Claude, or Perplexity a question and the answer cites or links your post, that is a leading indicator that your content is trusted enough to be quoted by a machine. Some of those readers click through, and they tend to arrive already informed and close to a decision.
How do I know if AI is citing my blog?
Two ways: the traffic, and the citation itself.
For traffic, GA4 added a native AI Assistant channel in May 2026. Go to Reports, then Acquisition, then Traffic acquisition, and set the primary dimension to Session default channel group. If you have had AI traffic since then, an AI Assistant row appears. It recognizes ChatGPT, Gemini, and Claude, though Perplexity and Copilot still land in the Referral bucket for now, so treat the number as a floor, not a ceiling.
To see which posts get cited, add Landing page as a secondary dimension. The pages collecting AI referrals are the ones being quoted, and that is the most actionable view in the whole exercise. To track your blog performance in AI answers over time, save this as a report you check monthly.
For the citation itself, spot-check it by hand. Ask ChatGPT or Perplexity the exact question your post answers and see whether you show up, and in what company. AI visibility (whether you are mentioned) and AI traffic (whether people click) are two different numbers, so keep them separate. Bing Webmaster Tools also publishes an AI performance report with citation data if you want a second source.
If you want the full setup, I covered it in how to track whether AI search is sending shoppers to your store, and the writing side in how to write content that gets cited in AI answers.
The vanity metrics to stop watching
Some numbers feel like progress and tell you almost nothing. Watching them is how founders either panic or get falsely comfortable. Honest measurement means knowing which numbers to ignore on purpose.
- Raw pageviews with no engagement. A thousand views that bounce in two seconds are worth less than fifty readers who stay two minutes. Look at engaged sessions, not raw hits.
- Impressions for queries you do not sell to. Ten thousand impressions for a keyword no buyer types is noise. Filter to queries that match what you actually sell.
- Social likes and shares. Nice for morale, disconnected from Shopify revenue. A share is not a shopper.
- Post count and word count as goals. Publishing 30 thin posts is not 30 units of progress. Google rewards depth, so twelve strong posts usually beat thirty shallow ones.
- Bounce rate. GA4 retired bounce rate as a primary metric and replaced it with engagement rate, a more honest read of whether people actually used the page.
- Rankings for terms nobody buys on. Position 1 for a keyword with no commercial intent looks great in a screenshot and does nothing for the store.
This is the studio's whole operating stance, applied to your dashboard: honest scope beats impressive scope. A smaller set of real numbers you trust will serve you better than a wall of charts that flatter you.
Your one-page monthly blog review
You do not need a paid tool or a complicated dashboard. You need fifteen minutes on the same day each month and five numbers written down. The value is in the trend, not the snapshot, so it only works if you do it monthly and compare.
| Number to record | Where it lives | Healthy direction |
|---|---|---|
| Total impressions | Search Console, Performance | Up month over month |
| Average position | Search Console, Performance | Down, toward page one |
| Top 3 pages by impressions | Search Console, Pages tab | The list grows and shifts upward |
| Assisted or blog-led conversions | GA4, Conversion paths or Landing page | Any, then more |
| AI referral sessions | GA4, AI Assistant channel | Appears, then grows |
What counts as healthy depends on how long you have been at it. By month 3, expect rising impressions and a few pages inching up in position, usually with few clicks. By month 6, expect several pages in the top 20, your first steady clicks, and maybe the first assisted conversions. By month 12, expect pages in the top 10 for specific terms, consistent organic clicks, and content that shows up in both Google and AI answers. If your curve looks like that, keep going. The revenue line follows this shape, just later.
Publishing pace matters here too, because a review is only meaningful if you are actually feeding the system. Two to three solid posts a week compounds. A burst of daily posts followed by silence does not. I made the full case in how often you actually need to publish.
When the numbers say change course
Measurement is not only permission to keep going. Sometimes it is permission to stop doing what is not working, which is different from quitting.
Here is the honest threshold. If, after 4 to 6 months, your impressions are flat and your average position is not improving on the pages you have pushed, that is a real signal. Ahrefs found that once a page has gone about six months without ranking progress, its odds drop sharply unless you change something. The fix is almost never to publish more thin posts faster. It is usually topic selection and depth: you are writing about things your buyers do not search, or writing about the right things too shallowly to compete.
So before you conclude the blog does not work, read the leading indicators first. Flat impressions point to a topic problem. Rising impressions with stuck position point to a quality or competition problem. Rising impressions and improving position with no sales yet point to nothing wrong at all, just time. Each of those diagnoses leads somewhere useful, and none of them is give up.
That is the difference measurement makes. Cancelling a content plan at day 30, or month two, means you never see what the work does, because the work does its visible part first and its paid part last. Watch the four leading indicators, run the one-page review, and you will always know which of those three situations you are in, and exactly what to do next.
Want the blog handled so you can just read the numbers?
The Studio Niza Blog Content service ships researched, schema-ready posts at a 2 to 3 a week cadence, the pace that actually compounds. You run the fifteen-minute monthly review, I run the publishing engine.
See how Blog Content works →Or email contact@studioniza.com if you have a specific question about your store. I read every one.
Frequently asked questions
If you're still unsure after reading these, just send the question.
How long before a Shopify blog starts making money? +
For most new stores, meaningful organic sales from content take 6 to 12 months, because pages have to climb into positions people click before they can drive revenue. The leading indicators, like rising impressions and improving position, show up much earlier, often within the first 2 to 3 months. Watch those to confirm the blog is on track before revenue arrives.
What is a good click-through rate for a Shopify blog? +
There is no single number, because CTR depends heavily on position. A page at position 30 will have a CTR near zero, and that is normal, while a page in the top 5 might see 5 to 20 percent. Track your own CTR trend as position improves rather than chasing a benchmark.
Can I measure blog ROI in Shopify's analytics alone? +
No. Shopify's built-in reports show sales and sessions but not search impressions, ranking position, or which posts assisted a conversion. To measure blog ROI on Shopify properly, you need Google Search Console for the search-side leading indicators and GA4 for engagement and assisted conversions. Both are free.
What is the difference between assisted and last-click conversions for a blog? +
Last-click credits only the final visit before a sale, which is rarely the blog. An assisted conversion credits the blog for helping start or move along a journey that another channel finished. Blogs live in the assist, so ignoring assisted conversions makes content look worse than it is. Check GA4's Conversion paths report to see it.
How do I know if AI is citing my blog? +
Check two things. In GA4, look at the AI Assistant channel under Reports, Acquisition, Traffic acquisition, and add Landing page to see which posts get AI referrals. Then spot-check by asking ChatGPT or Perplexity the exact question your post answers and seeing whether you appear. Traffic and visibility are separate numbers, so track both.
Is bounce rate a useful metric for a Shopify blog? +
Not really. GA4 replaced bounce rate with engagement rate, which measures whether visitors actually interacted with the page rather than just left. Engaged sessions and average engagement time tell you far more about whether a post is landing than an old-style bounce rate ever did.
Should I delete blog posts that get no traffic? +
Usually not, at least not quickly. A post with rising impressions but no clicks is still climbing, and deleting it throws away that progress. If a page has flat impressions after about six months, update and improve it before considering removal, since a refresh often revives a stalled post.
How many posts do I need before I can judge if my blog is working? +
Judge the system by trend, not by a magic number of posts. After roughly 8 to 12 solid posts and 3 months, you should have enough Search Console data to see whether impressions and position are trending up. If they are, the blog is working even if sales have not moved yet.