
You installed a chatbot on your Shopify store, connected it to your orders and your FAQ page, and switched it on. A week later you open the dashboard and there they are: conversations handled, deflection rate, response time, a satisfaction score. Most of the numbers are green.
And you still cannot tell whether the thing is actually helping your customers.
That gap is normal. Chatbot dashboards are built to look reassuring, not to answer the one question you care about, which is whether the bot is doing a good job or quietly annoying people while you are not looking. This post sorts your chatbot metrics for you. Six are worth watching because they tell you whether the bot resolves real problems and nudges real sales. Three are worth ignoring, or at least not celebrating, because they look impressive and mean very little for a small store.
There is also one weekly habit that catches a bot going wrong before a single customer complains. If you only have twenty minutes a week for this, that habit is where it belongs. None of this needs an analytics degree. It needs you to know which six numbers to read and which three to walk past.
Why a full dashboard doesn't mean a working bot
A busy dashboard is not proof of a working bot. Most of the headline numbers, deflection rate, response time, total conversations, measure whether the bot ended the conversation, not whether it solved anything. A customer who got a perfect answer and a customer who gave up in frustration can look identical in those numbers.
That is the trap. An efficiency number can stay high while the bot quietly trains your customers to stop asking for help. The fix runs through this entire post: pair every efficiency number with a quality one. Speed next to accuracy. Deflection next to satisfaction. Any single number can be gamed, on purpose or by accident, so no single number gets to be the verdict.
Put plainly, a high headline number is not the same as a helpful bot. The six metrics below are the ones that hold up when you look at them in pairs.
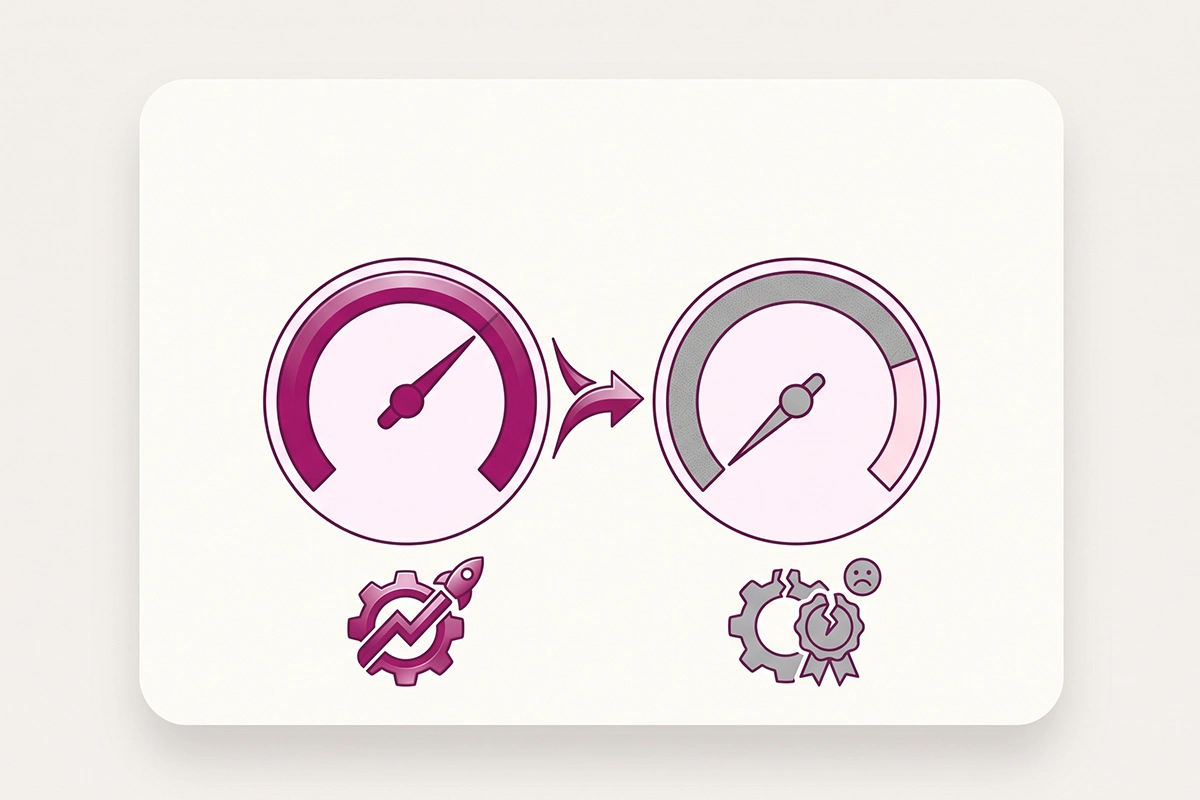
The 6 chatbot metrics worth watching
These six tell you whether the bot solves problems, escalates cleanly, answers accurately, owns the busywork, helps you sell, and keeps customers satisfied. Read them together, not one at a time.
| Metric | What it actually tells you | A rough target for a small store |
|---|---|---|
| Resolution rate | Whether the bot fixed the problem, not just replied | 50 to 70% of common questions |
| Handoff rate | How often it passes to you, and whether it does so cleanly | Watch the trend, not a fixed number |
| First-response quality | Whether the first answer was actually right | Spot-check weekly |
| Order-status containment | Whether the bot handles "where is my order" alone | High, this is the easy win |
| Sales-assisted sessions | Whether chats tend to precede completed orders | Any consistent signal is good |
| CSAT (bot-resolved) | Whether customers were satisfied by the bot itself | 75 to 85% |
Resolution rate
Resolution rate is the share of conversations where the bot actually solved the problem, confirmed, not just the share where the conversation ended. That distinction is the whole game. Gartner frames the goal of a support bot as an intelligent front door: something that understands what the customer wants and either handles it or passes it on cleanly. Resolution rate measures how often it truly handles it.
Vendor marketing often quotes resolution rates of 60 to 89 percent, but those are ceilings measured under ideal conditions, not what your store will see. For a well-tuned small-store bot answering common questions, 50 to 70 percent confirmed resolution is a healthy range. If you take one metric from this list, take this one. It is the closest thing to a single honest answer to whether the bot is working.
Handoff rate
Handoff rate, sometimes called escalation rate, is how often the bot passes a conversation to you. A rising handoff rate is not automatically bad. It can mean the bot is correctly recognising questions it should not answer, which is exactly what you want it to do.
What matters more than the number is whether the handoff is graceful. A good handoff captures the customer's question, tells them a human will follow up, and hands you the full context. A bad one drops the customer into a dead end or loops them back to the start. If handoff climbs and satisfaction holds, the bot is escalating well. If handoff climbs and satisfaction drops, something upstream is broken. It is worth getting the handoff to a human right early, because it is where trust is won or lost.
First-response quality
First-response quality is whether the bot's first answer was correct, not how fast it arrived. Speed is easy for a bot. Every bot is fast. Accuracy is the hard part, and it is the part that decides whether a customer trusts the next answer.
You cannot fully automate this one. The honest way to track it is to read a sample of first responses each week and mark whether each was right, close, or wrong. A bot that invents a tracking number or makes up a return window is worse than no bot, because the customer believes it. First-response quality is the metric that catches that before it spreads.
Order-status containment
Order status is the single biggest, most repetitive question in ecommerce support. "Where is my order," often shortened to WISMO, accounts for roughly 30 to 50 percent of support contacts for most stores according to Salesforce, and climbs higher during busy seasons. It is also the easiest question for a bot to own, because the answer already lives in your order data.
Order-status containment is the share of those questions the bot resolves without you. This is where a chatbot earns its keep for a small store. If your bot connects to Shopify orders and still hands most order-status questions to you, that is the first thing to fix. A bot that reliably answers where is my order is doing the highest-volume, lowest-value work so you do not have to. That is a big part of what a Shopify AI chatbot actually does well.
Sales-assisted sessions
Most owners think of a chatbot as a support tool and forget it can help sell. Sales-assisted sessions are chats that happened before a completed order: a sizing question answered, two products compared, a shipping cutoff confirmed. These are the conversations that quietly move someone from unsure to bought.
Cart abandonment sits near 70 percent across ecommerce according to the Baymard Institute, and a lot of that hesitation is one unanswered question. You do not need a precise attribution model here. Watching whether chat conversations tend to come right before orders, even loosely, tells you the bot is doing more than deflecting tickets.
Customer satisfaction (CSAT) on bot-resolved chats
Customer satisfaction, or CSAT, is usually a thumbs up or thumbs down at the end of a chat. The one rule that makes it useful: measure it separately for bot-resolved chats and human-handled chats. A blended score hides the exact thing you are trying to learn.
A well-tuned customer-facing bot tends to land around 75 to 85 percent satisfaction on the chats it resolves, which sits a little below human support, and that gap is normal. Below 75 percent is a signal to go read those conversations, not to panic. Expect only 15 to 30 percent of customers to leave a rating at all, which is also normal. What you are watching is the direction over time.
The 3 chatbot metrics to ignore (or stop celebrating)
None of these three numbers is useless. They are just not evidence that your bot is working, and vendors love to lead with them because they are always large and always green. Do not build your judgment on them.
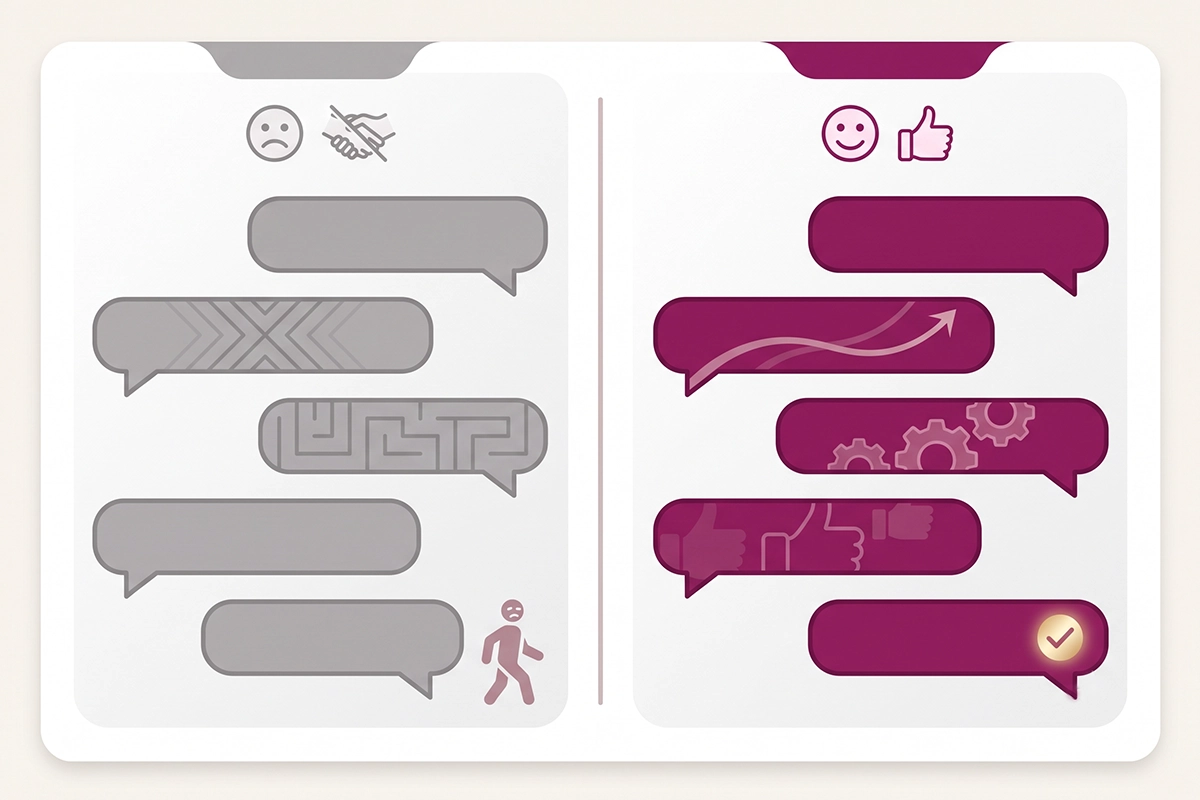
Total conversations handled
Total conversations is the first number most dashboards show, and it is the least informative. A big count tells you people clicked the widget. It says nothing about whether they left with an answer.
A bot that had 2,000 conversations and resolved 400 of them is not better than one that had 1,000 and resolved 600. Volume is context for your other metrics, not a metric in itself. Use it as the denominator. Do not celebrate it.
Deflection rate on its own
Deflection rate is the number vendors put in the biggest font, and it is the one to treat with the most suspicion when it stands alone. Deflection counts a conversation as handled if the customer stopped contacting you. Resolution counts it as handled only if the problem was actually fixed.
A customer who gets frustrated and gives up looks exactly like a customer who got a perfect answer. Both count as deflected. That is how a bot can post an excellent deflection rate while quietly training your customers to stop reaching out. Deflection is fine to watch next to CSAT and resolution. It is misleading on its own. If you want the longer version, I wrote a whole post on the difference between resolution rate and deflection rate.
Average response time
Average response time measures how quickly the bot replies. For a bot this is almost always excellent, because replying instantly is the one thing software is guaranteed to do well. A fast wrong answer is still a wrong answer.
Response time is a real constraint for human agents, where speed costs money. For a bot it is close to a vanity number. Track whether the answers are right, not whether they are fast, because the fast part was never in doubt.
The one weekly habit that catches a bad bot early
Here is the habit that does more than any dashboard: once a week, read ten to fifteen real transcripts. Not the summary, the actual conversations. Pick a few that ended in a handoff, a few that ended with a low rating, and a few at random.
You are looking for three things. Where the bot gave a wrong or vague answer. Where a customer had to rephrase the same question twice. And where the bot confidently said something that is not in your policies. Those three patterns are where a bot goes wrong, and they show up in transcripts weeks before they show up as a dip in your satisfaction score.

This is the part most self-serve chatbot setups quietly skip, because reading transcripts is unglamorous and nobody sells it. It is also why the Studio Niza chatbot service includes monitoring time every month: someone has to actually read the conversations and fix the answers that miss. A dashboard tells you a number moved. A transcript tells you why.
A three-tier rhythm works well. A two-minute daily glance at volume and any sentiment flags. A thirty-minute weekly transcript read. A monthly look at cost and resolution trends. The weekly read is the one that catches problems early, so if you protect one slot, protect that one. If your bot is brand new, the first month has its own rhythm, which I covered in what to monitor and tune in the first 30 days.
Build a scorecard you'll actually check
You do not need a custom analytics build. You need six numbers in one place and a rhythm for looking at them. Here is a scorecard a solo owner can keep in a spreadsheet or read straight off the bot's dashboard.
| Cadence | What to check | Time |
|---|---|---|
| Daily | Conversation volume, any sentiment or fallback flags | 2 min |
| Weekly | Resolution rate, handoff rate, CSAT, plus 10 to 15 transcripts | 30 min |
| Monthly | Order-status containment, sales-assisted sessions, cost per conversation | 1 hr |
The point of the cadence is to match effort to payoff. Daily catches fires. Weekly catches drift. Monthly tells you whether the bot is worth what you pay for it. Industry benchmarking puts a human-handled ticket at several dollars to resolve and a bot-resolved one at cents, so the monthly cost view is usually where the bot's value becomes obvious for a small store.
Wrapping up
A chatbot dashboard is designed to reassure you. Your job is to look past the reassuring numbers to the honest ones. Six are worth watching: resolution rate, handoff rate, first-response quality, order-status containment, sales-assisted sessions, and CSAT on bot-resolved chats. Three are worth walking past: total conversations, deflection rate on its own, and average response time.
On Monday, open your dashboard and find those six. If your tool does not show all of them, that tells you something too. Then read ten transcripts. That single habit will teach you more about your bot in twenty minutes than a month of watching the deflection number climb.
If you are still deciding whether a bot makes sense for your store at all, that is a fair question with an honest answer, and I wrote about whether chatbots actually work for small stores separately. And if you would rather have someone watching these numbers for you, that is what the chatbot service is for.
Want someone watching these numbers for you?
The Studio Niza AI Chatbot service includes the monitoring most self-serve setups skip: reading real transcripts every week, tuning the answers that miss, and keeping order-status containment high. Setup is $599, then $99/month.
See how the chatbot service works →Or email contact@studioniza.com if you have a specific question about your store. I read every one.
Frequently asked questions
If you're still unsure after reading these, just send the question.
What is a good resolution rate for a Shopify chatbot? +
For a well-tuned bot answering common questions, 50 to 70 percent confirmed resolution is a healthy range for a small store. Vendor-quoted rates of 60 to 89 percent are ceilings measured under ideal conditions, not guarantees. The number that counts is the one measured on your own catalogue, policies, and customers.
Is deflection rate a bad metric? +
Deflection is not a bad metric, it is an incomplete one. It counts a conversation as handled if the customer stops contacting you, which means a frustrated customer who gives up looks the same as a happy one. Watch deflection next to CSAT and resolution rate, never on its own.
How often should I check my Shopify chatbot metrics? +
A simple rhythm works: a two-minute daily glance at volume and any alerts, a thirty-minute weekly read of ten to fifteen transcripts, and a monthly look at cost and resolution trends. The weekly transcript read is the habit that catches problems before customers complain. Protect that slot above the others.
Should I measure chatbot CSAT separately from my human support CSAT? +
Yes. A blended score hides whether the bot itself is satisfying customers. Measure CSAT separately for bot-resolved and human-handled chats so you can see the bot's real performance, which for a well-tuned bot usually sits around 75 to 85 percent.
Can chatbot metrics be gamed? +
Yes, often by accident rather than on purpose. Almost any efficiency number can look strong while quality quietly drops, which is why you pair every efficiency metric with a quality one. Reading real transcripts each week is the check that keeps the numbers honest.
What chatbot metrics matter most for a small Shopify store? +
Six: resolution rate, handoff rate, first-response quality, order-status containment, sales-assisted sessions, and CSAT on bot-resolved chats. Together they tell you whether the bot solves problems, escalates cleanly, answers accurately, handles order status, helps sales, and keeps customers satisfied. The three to ignore are total conversations, deflection rate on its own, and average response time.